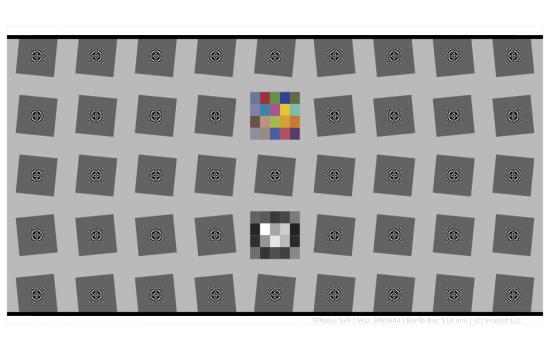
Sineimage SFRplus Charts: Inkjet Paper - 4: 1 Contrast Transparency
The MTF50 for this SFRplus test chart and for all our inkjet printed charts is about 5 cycles per millimeter.
For a comparison of reflective surfaces, and when this means choosing your chart, visit our reflective surface to compare blogs.
Remember this when selecting the chart size. Too small a chart using a high-resolution sensor can cause the MTF of the chart to decrease the MTF of the camera system. In addition, it is important to use a large enough chart to accommodate the minimum focal length, as well as the sensor's results.
|
model |
SFRplus |
|
types |
Transparent |
|
format |
Custom design |
|
Contrast |
4:1 |
SFRplus test chart options are available to support a wide range of image test applications.
Options include:
Contrast options
1. 4: 1 contrast ratio with the upcoming new ISO-12233 specifications to match.
2. Contrast Ratio of 10: 1 and 2: 1 Using both contrast levels improves the ability to analyze non-linear signal processing, which may not affect the 2: 1 contrast region with low contrast
The contrast ratio of 10: 1 only improves the 3D performance integrity of the entire imaging surface.
Paper Type - Semi-gloss or matte options
Matte paper can be lit more easily because it has less specular reflection than semi-glossy paper. The MTF is slightly lower than the semi-glossy paper with no dark shades on the step chart.
2. Semi-gloss paper is slightly more detail than matte, with darker black tones on the ladder and is recommended for most applications except for wide-angle lenses.
Square grid size options
1. For a typical DSLR format with a 3: 2 aspect ratio and a typical HDTV format with a 16: 9 aspect ratio, a 5x9 grid size is recommended.
2. For a typical compact camera with a 4: 3 aspect ratio, a 5x7 grid size is recommended.
Inkjet solution
The MTF50 for this SFRplus test chart and for all our inkjet printed charts is about 5 cycles per millimeter. For a comparison of reflective surfaces, and when this means choosing your chart, visit our reflective surface to compare blogs. Remember this when selecting the chart size. Too small a chart using a high-resolution sensor can cause the MTF of the chart to decrease the MTF of the camera system. In addition, it is important to use a large enough chart to accommodate the minimum focal length, as well as the sensor's results.
Paper size and activity area options
The chart has five main dimensions to choose from, depending on the grid size you choose. It is recommended that you use a medium-sized chart test imaging system with sensors up to 12 MP, large maps for sensors above 12 MP and up to approximately 24 MP, and oversized maps for sensors above 24 MP.
Paper size (including margins)
|
|
Squared size |
|
5x9 |
5x7 |
|
Plus small
|
8.5“×15” |
8.5“×10” |
|
small |
14“×24” |
14“×20” |
|
M |
24“×40” |
24“×34” |
|
Big |
44“×60” |
44“×60” |
|
Increase |
44“×74” |
44“×64” |
Activity area
The active area of the chart includes white space above and below the top and bottom bar. It is slightly larger than the print area, defined by the upper and lower deformation bars. The blank area is included in the active area because the chart's test image must contain this blank area to be processed automatically in the SFRplus software.
|
|
Squared size |
|
5x9 |
5x7 |
|
Plus small |
7.85“×15” |
6.75“×10” |
|
small |
12.5“×24” |
13.5“×20” |
|
M |
22“×39.22” |
22“×33” |
|
Big |
33“×59” |
40“×59” |
|
Increase |
42“×72” |
42“×59” |
Color chart options
Contains color charts to test color accuracy. If the color option is selected, the focus-focused "star" pattern is replaced with a 20-color chart.
Pre-distortion options
The predistortion chart provides the ability to map the wide-angle or fisheye lens periphery using SFRplus. These distortion levels are available
|
Level |
matrix |
|
No distortion |
[1 1] |
|
distort |
[0.833 1.123] |
|
Twisted + |
[1.167 1.577] |
|
Ultradistort |
[1.167 1.982] |
We do not recommend using semi-glossy paper for wide-angle lenses or pre-distortion charts


 Home
Home Phone
Phone Top
Top