Reflection color Overflow coins (dead leaf) Test chart measuring texture clarity
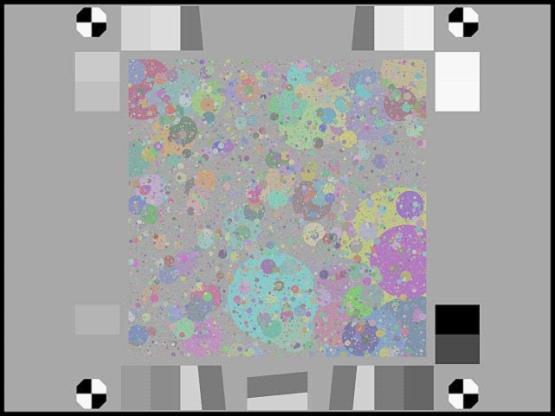
The Color Spilled Coins test chart (a variation of the Dead Leaves test chart) used to measure texture sharpness has several advantages over the older Dead Leaves chart.

Main features:
Scattered coin patterns in the central area are almost completely dimension-independent (unlike traditional tethered tet charts), enhancing the accuracy and robustness of MTF measurements so they do not differ from other methods of RAW images, such as slanted edges Uniform or non-linear treatment).
The maximum contrast range is 3: 1, as required by the draft specifications of the draft specification for draft texture blur metrics in the third phase of the CPIQ.
It is more uniform, ie more invariant than other dead leaf diagrams.
It contains sloping edges (2: 1 and 4: 1 contrast) for easy comparison with dead leaf patterns.
The gray area to the left and right of the dead leaf pattern has the same average density as the dead leaf pattern so that it can be used for effective noise PSD removal using McElvain et al. people. technology.
Includes registration mark and 16 grayscale patches. The linear level used to create grayscale patches is 0 to 255 in steps of 17 (same as the Siemens star chart in the upcoming draft of the ISO 12233 standard).
Spill coin test chart size |
Spilled coin area |
Printing area |
Total media size |
L |
12“×12”
305mm×305mm |
22.4“×16.8”
569mm×426mm |
24“×18”
610mm×458mm |
M |
8“×8”
203mm×203mm |
14.93“×11.2”
379mm×284mm |
16“×12”
458mm×305mm |
X |
6“×6”
152mm×152mm |
11.2“×8.4”
284mm×213mm |
12“×10”
305mm×254mm |
X-Small(High-precision transmission) |
5.536" ×5.536"
141毫米×141毫米 |
9.25“×7.75”
159mm×197mm |
10“×8”
254mm×203mm
|
Note: We only support any custom test chart only with high-resolution images and dimensions.
Color bar test chart |
Transparent lightbox transparent test chart |
.jpg) |
.png) |
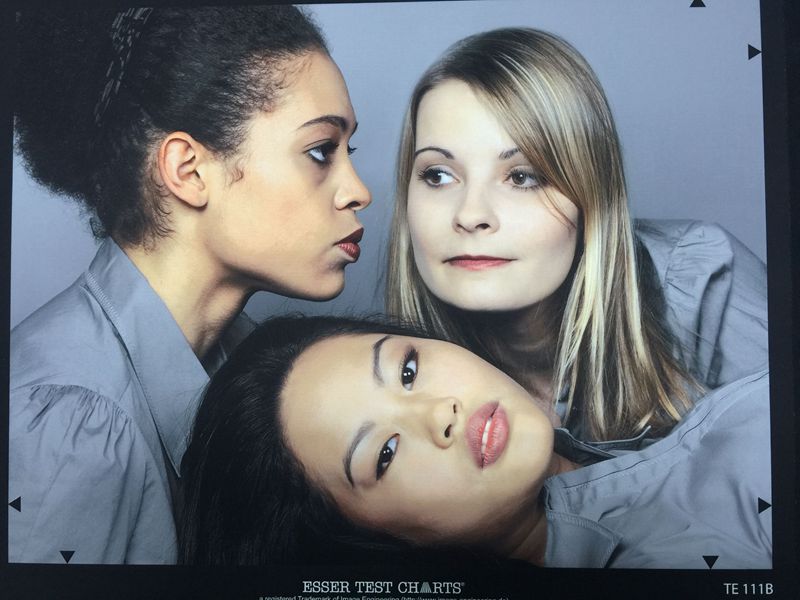
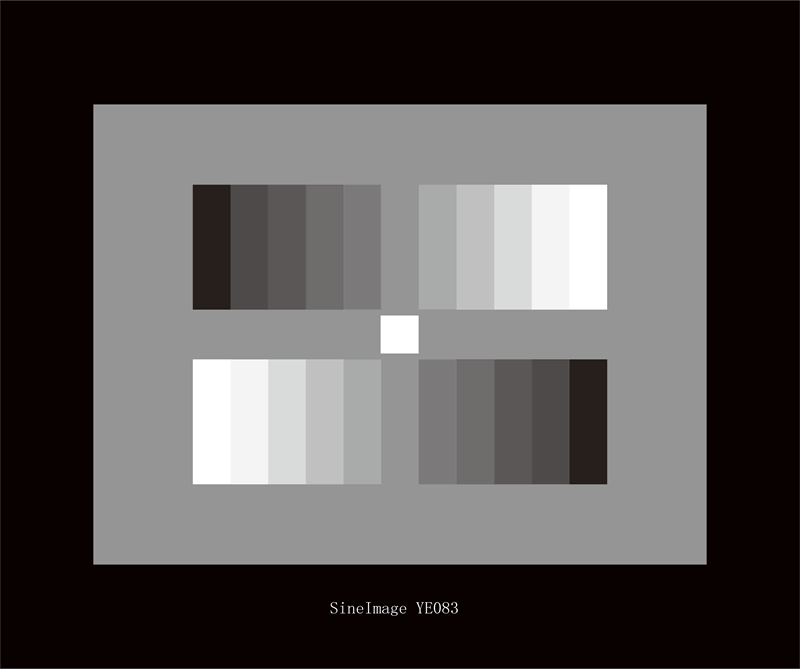
Skin test chart |
Grayscale test chart |
 |
 |