Sineimage HDTV Universal Test Chart YE0117
Sineimage HDTV Universal Test Chart The YE0117 is a fast (primarily visual) evaluation of the transmission characteristics of HD cameras. It consists of a gray background with circles, grayscales, horizontal and vertical lines all on the background.
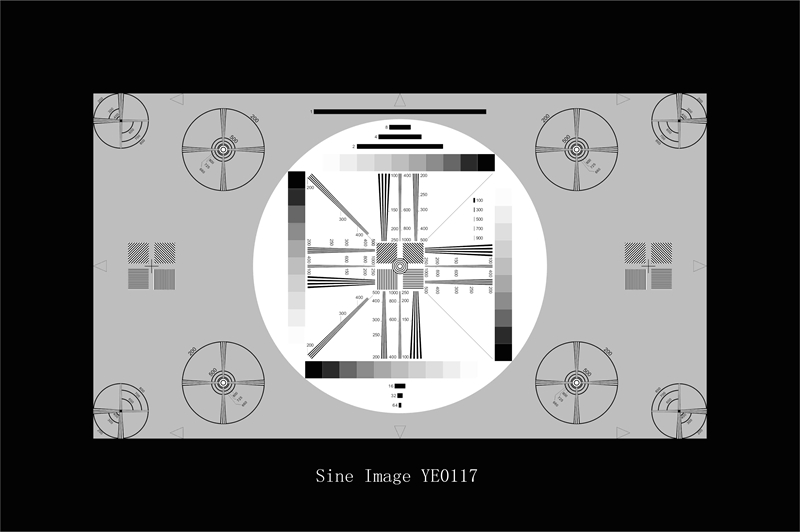
In the center of the test pattern on a gray background (D = 0.75; reflectivity = 18%) a white circle of grayscale and resolution wedges was located. Arranged four resolution circles on either side of the center circle.
|
model |
YE0117 |
|
Types of |
Reflective / transparent |
|
format |
Custom design |
|
ratio |
16:9 |
The 16: 9 format is marked by four arrows located on the horizontal and vertical centerlines. In addition, the four arrows near the top and bottom of the picture indicate the 4: 3 format. The test chart can also be used to test 4: 3 cameras.
The white center circle shows the four gray levels of each of the 11 steps. They increase linearly from D = 0.15 to D = 1.65 with the same linearity for checking the halftone reproduction of HDTV cameras. Due to the surrounding white area, the result may be acceptable.
All frequency values in the test chart are expressed in cph (number of cycles per height). On the center circle, the resolutions of three different frequencies are arranged vertically and horizontally. They range from 100 to 250, from 200 to 500 and from 400 to 1000 cph. In addition, the two resolution wedges at an angle of 45 ° produce a frequency of 200 to 500 cph.
In the middle of the test plot, there are four squares on the left and right, and the raster tilt angles are 0 °, 45 °, 90 ° and 135 °. They produce 200 cph frequency. Those line gratings that are tilted at 45 ° and 135 ° produce different frequencies (141.4 cph) in the horizontal and vertical directions (due to their tilt). The eight outer permutations can be used in both 16: 9 and 4: 3 formats. Larger wedge with cruciform resolution. Circular rings, also useful for checking geometry, are designed to mark the resolution vertically and horizontally. The resolution shows 200, 500, 660, 725 and 800 cph.
Four corners of the outer ring has a longer resolution wedge. They cross at a rate of 500 cph and have a mark from 200 to 800 cph.
Bar elements in the center, gray and white regions of the test pattern are arranged in length 1 (= half the image height), 2, 4, 8, 16, 32 and 64 cph. From left to right vertical grayscale has five extra short bars, 100, 300, 500, 700 and 900 cph.
|
SFRplusTest chart |
sfrTest chart |
.png) |
 |
|
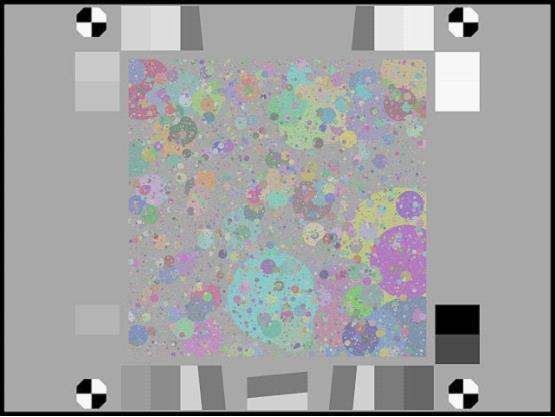
Texture test chart |
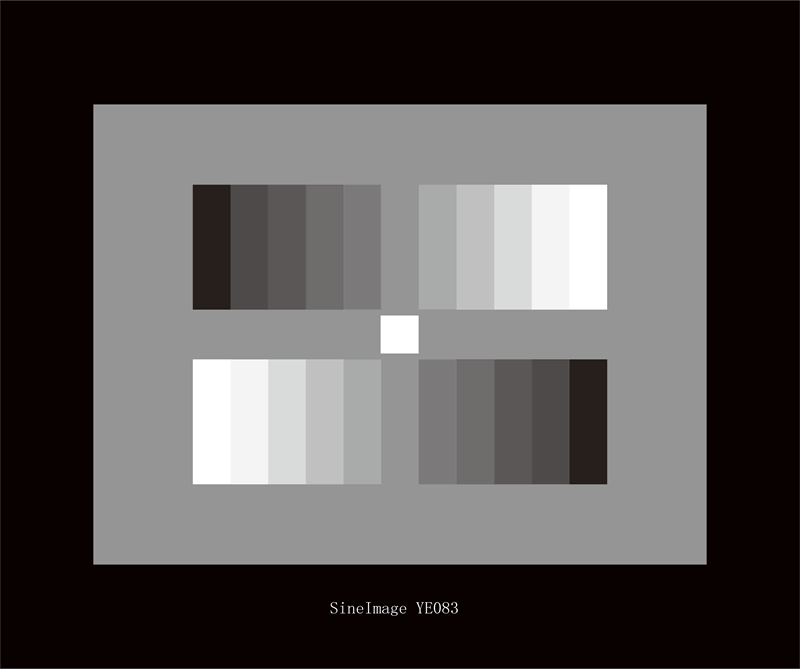
Grayscale test chart |
 |
 |


 Home
Home Phone
Phone Top
Top